Project Team 13: Parking, DS 4200 F19
Daniel O'Connor, Raymond Hyang, Yilang Wan
Service-Learning Course Project as part of DS 4200: Information Presentation and Visualization, taught by Prof. Cody Dunne, Data Visualization @ Khoury, Northeastern University.
Motivation
Increased automobile usage in Boston and the world in general has made the availability of parking spaces a problem today. Furthermore, allocation of parking spaces must take into consideration the rights of an area's residents while maximizing parking availability for the non-residential public, which is important businesses, tourism, and commuting professionals among others. Making these decisions without adequate can be impossible, but parking data is hard to come by, as it cannot be collected by any kind of automatic electronic data and is not highly regulated on a day to day basis. Parking studies require time and money or volunteers. Thus, our project conducted a parking study in the Chester Square neighborhood and created interactive visualizations that can guide these decision making processes, discover inefficiencies in the existing system, propose solutions based on data, and communicate these decisions, problems, and solutions to stakeholders.
Demo Video
Visualization Explanation
Chester Square Parking Spot Occupancy Heatmap
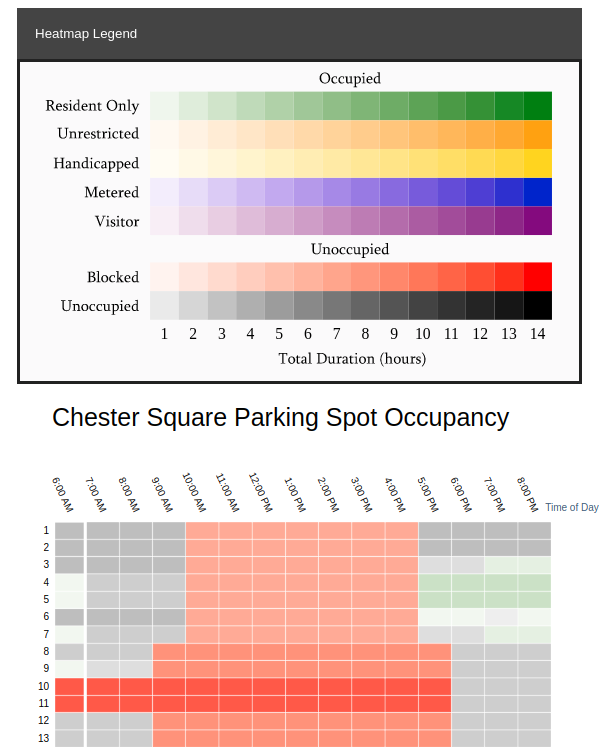
This heatmap shows the occupancies for all the parking spots throughout the day, alongside the amount of
time a parking spot has been consecutively occupied for. The idea for this chart is to give insight into
all individual spots we collected data for. The spots are colored by their regulation, as in the other charts.
The darker the color scale for a spot, the longer it has been consecutively occupied. You can brush over the
rows and columns to filter down the other two charts.
The dropdown legend shows each regulations color, and the color saturation+lightness shows how long a particular spot
has been occupied.
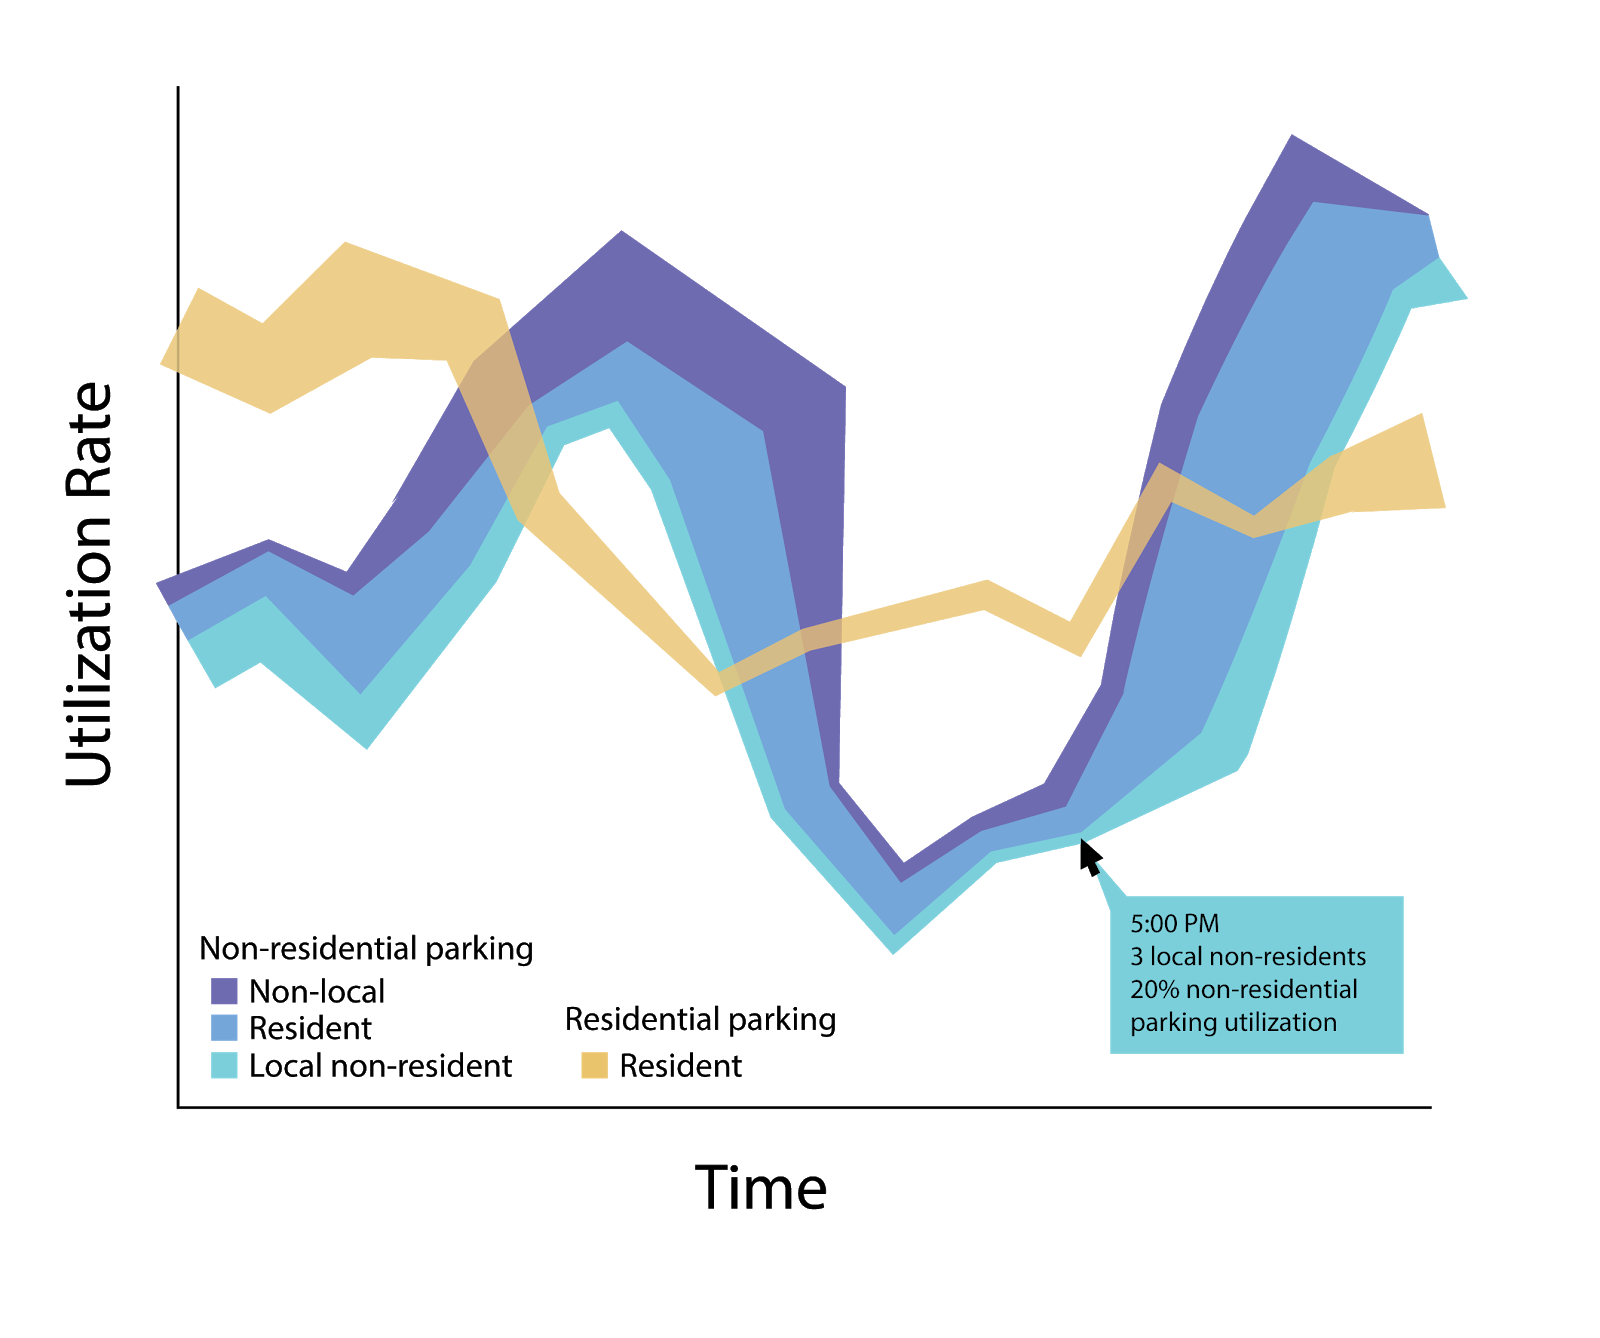
Chester Square Parking Spot Utilization by Regulation Type
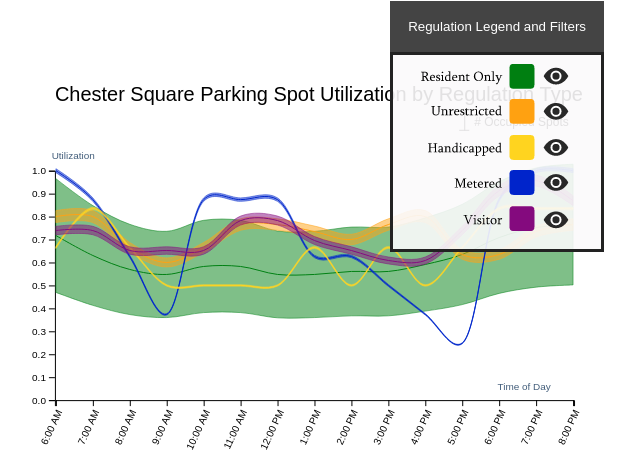
The area chart shows the utilization rate of parking spots for each regulation. The utilization rate is the number
of occupied spots divided by the number of total spots at a given time. The position of each area on the y-axis shows
the utilization rate. The amount of area each regulation takes up corresponds the the number of occupied spots at
a given time. We choose an area chart since we believed it useful to be able to gauge how the utilization rate
correlates to the number of parking spots for the regulation. You can brush over the x-axis to select the corresponding
time range on the Chester Square Parking Spot Occupancy Heatmap.
The regulation legend shows what regulation each area corresponds to, and can be used to filter down all the charts.
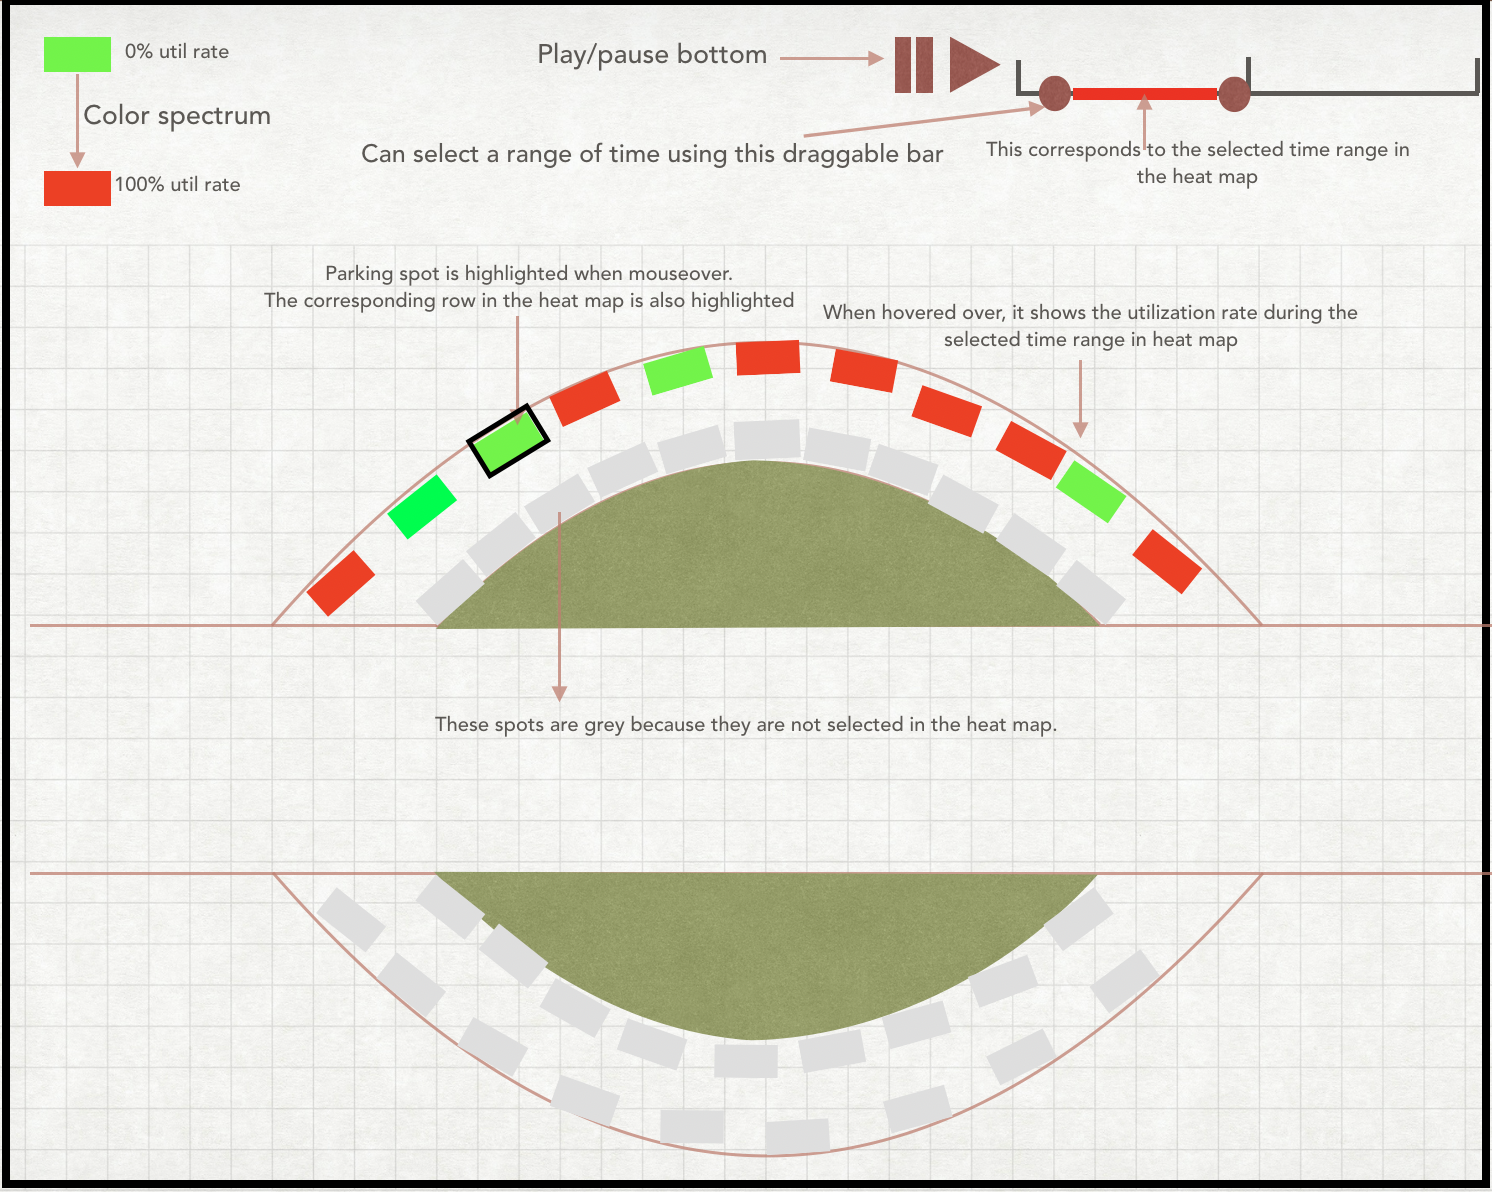
Parking Map
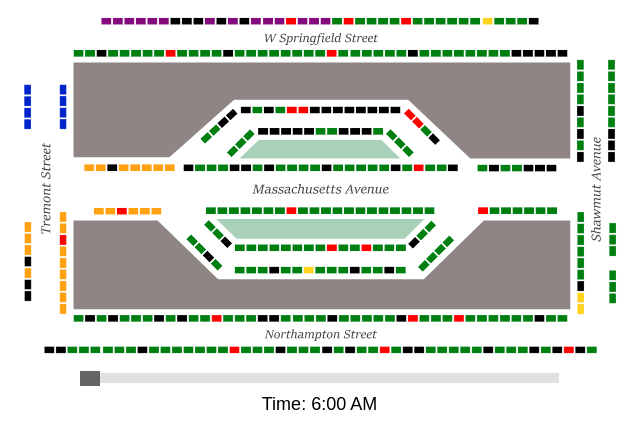
The parking map shows the physical location of the spots seen on the Chester Square Parking Spot Occupancy Heatmap, and is
intended to be used to relate the data shown on the heatmap with the actual parking spots in Chester Square. Parking spots
are color coded by regulation, just as the other two charts are.
The time range slider on the bottom can be used to see how the occupancies of parking spots change throughout the day.
Data Analysis
Data was collected by a few teams on Tuesday, October 22, 2019 in three five hour shifts from 6 am to 8 pm in teams of 2. A route was prepared, and pairs of volunteers walked the route starting on the hour. We recorded the first three letters of each license plate and noted abnormalities such as construction or incidents of double or otherwise illegal parking behavior. We also recorded whether a vehicle has an out-of-state license plate or a resident parking sticker. Routes were divided up into a realistic number of spaces for the area between landmarks (lampposts, driveways, hydrants, etc). Each round of records took 30 to 50 minutes. After collection, the data was entered by another team in a spreadsheet and shared. No additional data sources were used.
Task Analysis
The primary consumer of our visualization would most likely be partner organization members and anyone who is actively working to identify problems and create solutions in the neighborhood. We intend our visualization to be used for summarizing who is using parking, identifying trends in parking usage, and possibly discover policy or infrastructural changes that can be made in the neighborhood that can result in improvements based on data.
Design Process
AreaChart
Initial Sketch
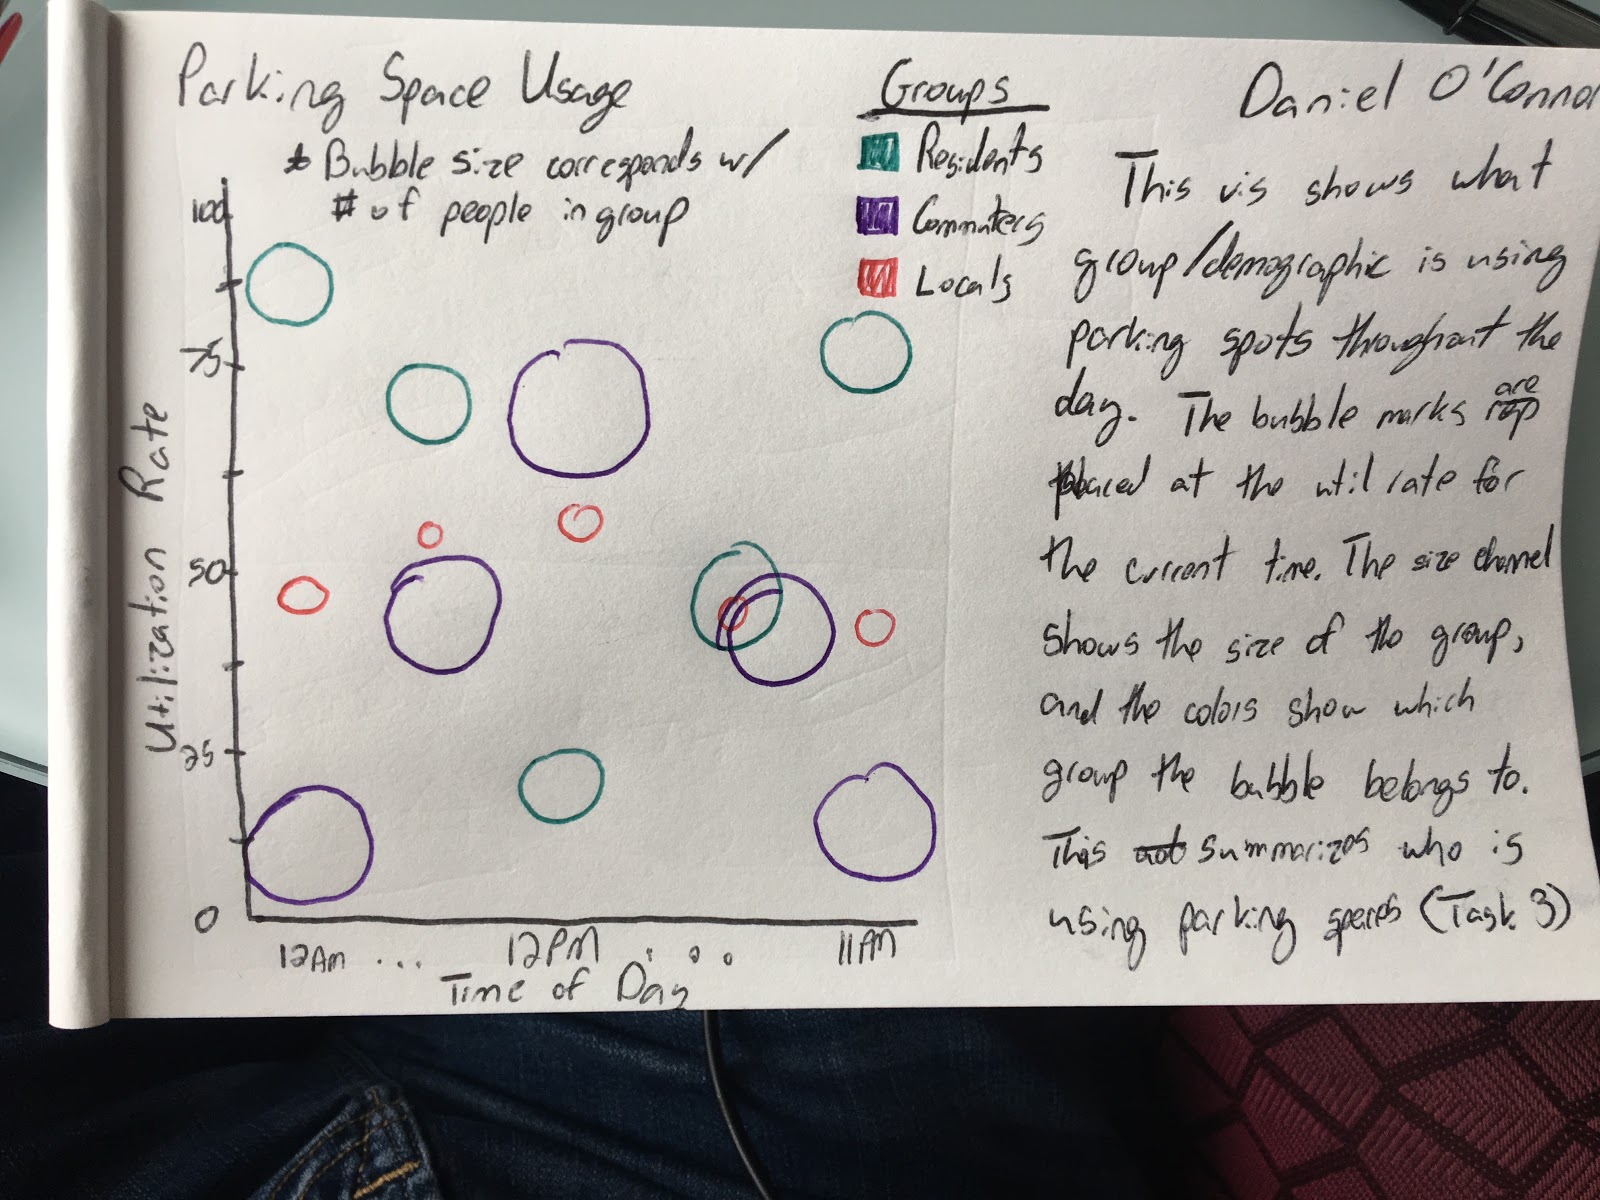 The area chart started off as a bubble chart, but we felt an area chart made more sense with
the linear format of the data.
The area chart started off as a bubble chart, but we felt an area chart made more sense with
the linear format of the data.
Sketch V2
 The final area chart idea captures all of the same information as the bubble chart sketch.
Heatmap
Initial Sketch
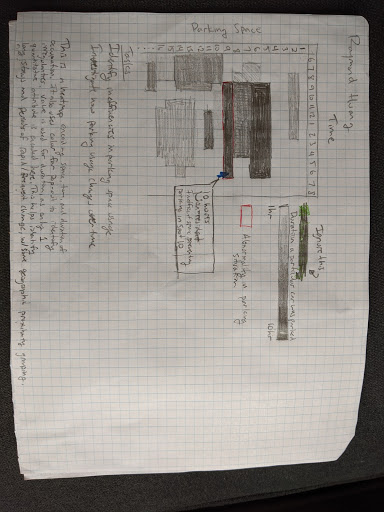 We wanted a information complete visualization of parking data, and felt a heatmap is the most
direct translation from the tabular data we collected to a visualization.
We wanted a information complete visualization of parking data, and felt a heatmap is the most
direct translation from the tabular data we collected to a visualization.
Sketch V2
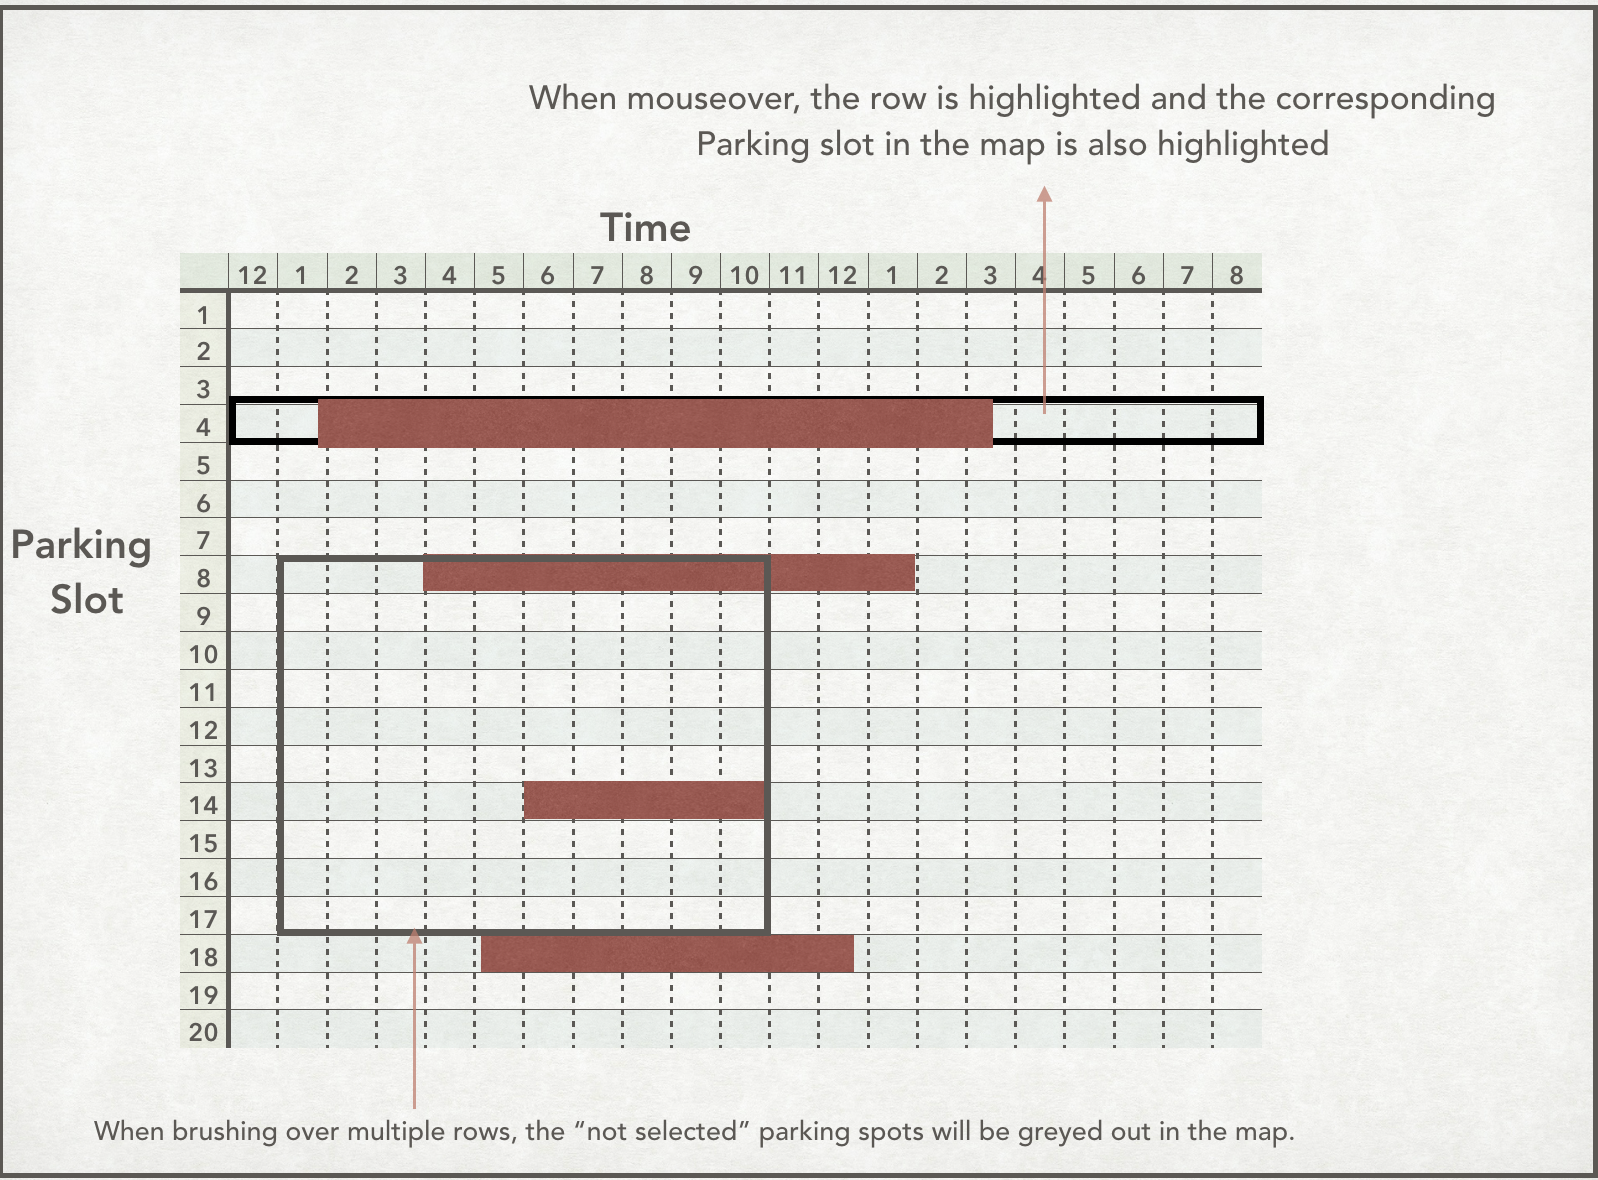 In the end, our final version came out pretty similar to this sketch, except we encoded blocked
or unoccupied spaces with colors instead of leaving them out.
In the end, our final version came out pretty similar to this sketch, except we encoded blocked
or unoccupied spaces with colors instead of leaving them out.
Parking Map
Initial Sketch
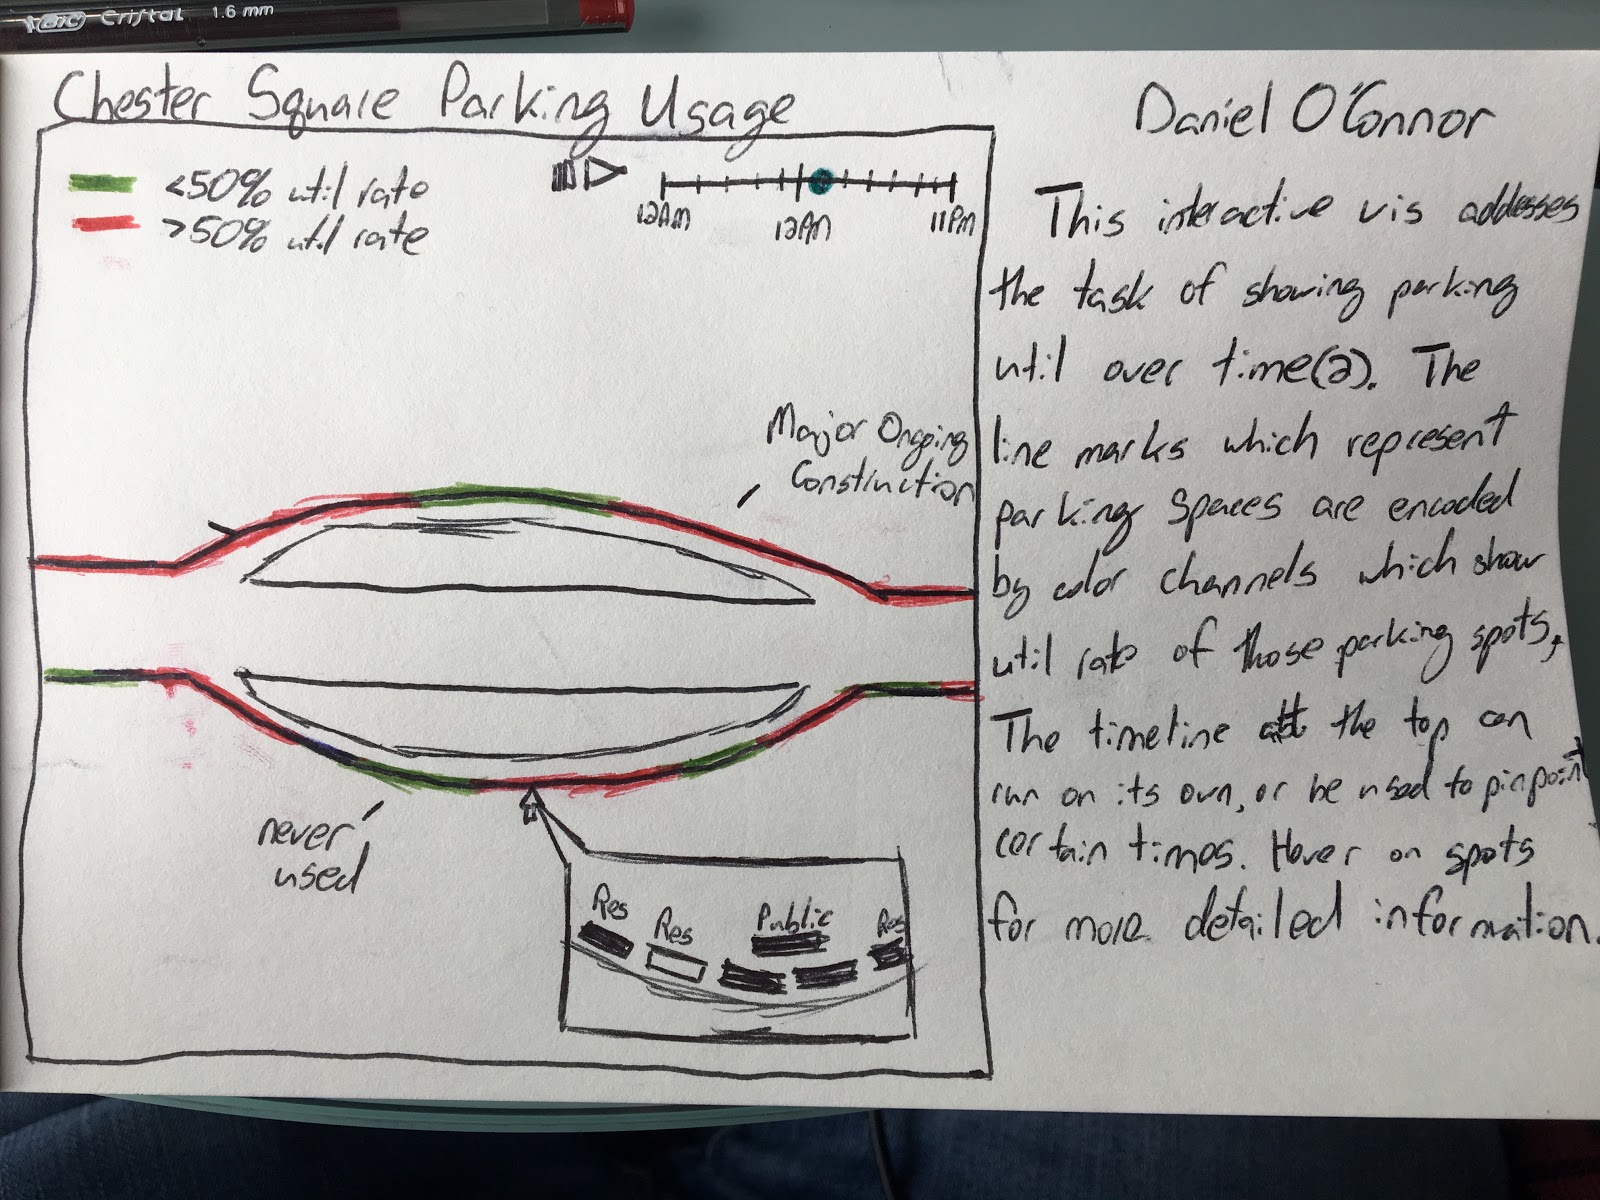 We wanted a visualization that maps the parking spot data we collected to the physical location of
the parking spot.
We wanted a visualization that maps the parking spot data we collected to the physical location of
the parking spot.
Sketch V2
Conclusion
We hope our visualizations prove helpful to the Chester Square Neighborhood Association in exploring the parking situation in Chester Square today. The area chart gives a general overview of how each type of parking spot gets utilized throughout the day, and the heatmap and actual map allows the user to drill in on more specific parking spots. In the future, we wish we could have made the charts a little more performant, and hope to be able to provide more details on demand.
Acknowledgments
- D3: Data-Driven Documents by Mike Bostock.
- Pure CSS responsive "Fork me on GitHub" ribbon by Chris Heilmann